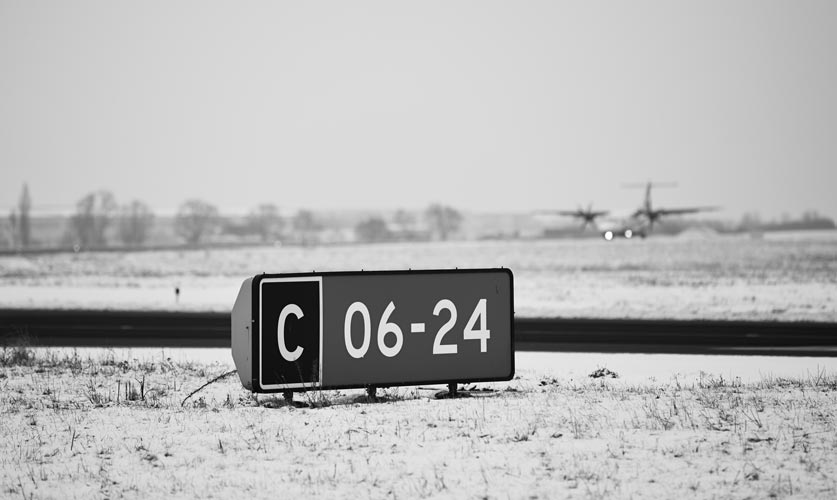
High brake demand

See every hard stop within minutes of landing

See every
hard stop
within minutes of landing

Landing-level evidence for inspection and treatment decisions

Landing-level evidence for inspection and treatment decisions

Landing-level evidence for inspection and treatment decisions

What each landing reveals about braking effort

ABARnet™ flags a High Brake Demand (HBD) landing when braking effort is elevated*, mapping where on the runway the hard braking began and ended. HBDs are common, even at medium or better braking action, and reflect factors such as:

Aircraft type + landing weight

Runway geometry + exit locations

Exit strategy + braking configuration

Runway use + traffic volume

Surface conditions like rain, snow, ice, + rubber buildup

Operational impact:

See where braking energy concentrates on your runway, so inspection and maintenance crews can focus first on the sections absorbing the most.

*

"High" brake demand is when hydraulic pressure reaches ≥1400 PSI on both main gears for 3+ seconds.

PROCESS

How we [capture] high braking on the runway

Over time, HBDs show where aircraft are:

Braking harder

Rolling longer

Missing exits

01: Detect

Each landing's braking data reaches AST in one ACARS message and becomes an ABAR, in RCAM-style format, about 2 minutes after touchdown. A landing is flagged as HBD when hydraulic pressure holds at ≥1,400 PSI on both main gears for 3+ seconds.

Each landing's braking data reaches AST in one ACARS message and becomes an ABAR, in RCAM-style format, about 2 minutes after touchdown. A landing is flagged as HBD when hydraulic pressure holds at ≥1,400 PSI on both main gears for 3+ seconds.

02: Expose

HBDs are mapped to runway segments, and in weather, often arrive with friction-limited landings. Example: In one Northeast storm, a runway logged 2 HBDs and 3 friction-limited landings in 68 minutes, across three carriers.

HBDs are mapped to runway segments, and in weather, often arrive with friction-limited landings. Example: In one Northeast storm, a runway logged 2 HBDs and 3 friction-limited landings in 68 minutes, across three carriers.

03: Adapt

When HBDs recur in the same sections, 360° Runway Analytics measures that pattern as Braking Demand and helps show whether the surface or the operation is driving it.

When HBDs recur in the same sections, 360° Runway Analytics measures that pattern as Braking Demand and helps show whether the surface or the operation is driving it.

8,300+

HBD landings at major hubs since 2024

~2,000/mo

~2,000/mo

~2,000/mo

HBDs across U.S. airports

1/4

Landings exceed normal braking demand

Airport impacts

Act on the last landing, not the last inspection

With HBD reports in hand, airport teams can:

Review storms

Review storms

Review storms

landing by landing, alongside friction-limit reports and treatment logs.

Measure the impact

Measure the impact

Measure the impact

of treatment or operational changes on how aircraft brake, section by section.

Brief stakeholders

Brief stakeholders

Brief stakeholders

with objective, aircraft-measured data on how your runways are performing.

Plan long-term

Plan long-term

Plan long-term

Plan long-term

with a running record to read against traffic, weather, and your own maintenance history.

"A pilot standing on the brakes is information. Until now, it left the airport with the aircraft. Data on elevated braking puts it in the hands of the people who maintain the runway."

Joe Vickers

CEO, AST

"A pilot standing on the brakes is information. Until now, it left the airport with the aircraft. Data on elevated braking puts it in the hands of the people who maintain the runway."

Joe Vickers

CEO, AST

"A pilot standing on the brakes is information. Until now, it left the airport with the aircraft. Data on elevated braking puts it in the hands of the people who maintain the runway."

Joe Vickers

CEO, AST

ABARnet™

Improve runway maintenance and uptime

ABARs: Use approved data directly from aircraft

Friction Forecasts: Anticipate runway closures with AI

360° Runway Analytics: Read every 100-ft section

Available for any aircraft type - Boeing, Airbus, etc.

Achieves a level of accuracy that others do not

let's CONNECT

Get on board with precise reports

ABARnet™

Improve runway maintenance and uptime

ABARs: Use approved data directly from aircraft

Friction Forecasts: Anticipate runway closures with AI

360° Runway Analytics: Read every 100-ft section

Available for any aircraft type - Boeing, Airbus, etc.

Achieves a level of accuracy that others do not

let's CONNECT

Get on board with precise reports

ABARnet™

Improve runway maintenance and uptime

ABARs: Use approved data directly from aircraft

Friction Forecasts: Anticipate runway closures with AI

360° Runway Analytics: Read every 100-ft section

Available for any aircraft type - Boeing, Airbus, etc.

Achieves a level of accuracy that others do not

let's CONNECT

Get on board with precise reports